Problem Layout
From “Exploiting symmetries within constraint satisfaction search” by P. Meseguer and C. Torras, Artificial Intelligence 129, 2001: given a grid, we want to place a number of pieces such that every piece is completely included in the grid and no overlapping occurs between pieces. See also CSPLib (Problem 132).
An example is given, where three pieces have to be placed inside the proposed grid. 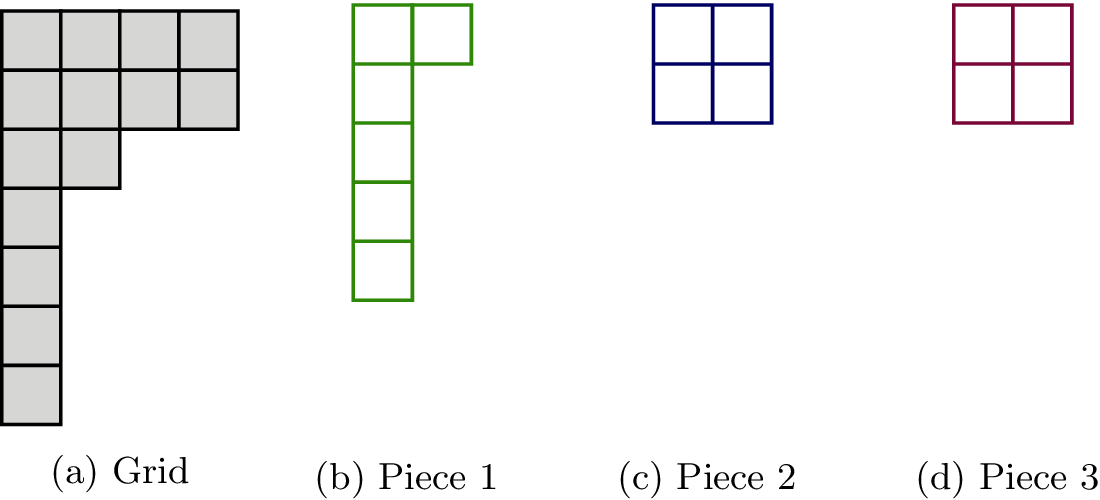
To build a CSP (Constraint Satisfaction Problem) model, we need first to import the library PyCSP$^3$:
from pycsp3 import *
Then, we need some data. Here, we decide to represent the grid and the pieces by two-dimensional matrices (0 being used to discard some cells).
grid = [
    [1,1,1,1],
    [1,1,1,1],
    [1,1,0,0],
    [1,0,0,0],
    [1,0,0,0],
    [1,0,0,0],
    [1,0,0,0]
]

shapes = [
    [[1,1],
     [1,0],
     [1,0],
     [1,0],
     [1,0]
    ],
    [[1,1],
     [1,1]
    ],
    [[1,1],
     [1,1]
    ]
]
We define a few constants.
n = len(grid)
m = len(grid[0])
nShapes = len(shapes)
We start our CSP model by introducing a first array $x$ of variables.
# x[i][j] is the index of the shape occupying the cell at row i and column j of the grid (or -1 if the cell is free)
x = VarArray(size=[n, m], dom=lambda i, j: {-1} if grid[i][j] == 0 else range(nShapes))
We can display the structure of the array $x$, as well as the domain of the variables on the first and last row of $x$.
print("Array x: ", x)
print("Domains for first row of x: ", [x[0][j].dom for j in range(m)])
print("Domains for last row of x: ", [x[-1][j].dom for j in range(m)])
Array x:  [
  [x[0][0], x[0][1], x[0][2], x[0][3]]
  [x[1][0], x[1][1], x[1][2], x[1][3]]
  [x[2][0], x[2][1], x[2][2], x[2][3]]
  [x[3][0], x[3][1], x[3][2], x[3][3]]
  [x[4][0], x[4][1], x[4][2], x[4][3]]
  [x[5][0], x[5][1], x[5][2], x[5][3]]
  [x[6][0], x[6][1], x[6][2], x[6][3]]
]
Domains for first row of x:  [0..2, 0..2, 0..2, 0..2]
Domains for last row of x:  [0..2, -1, -1, -1]
For the second array we need to declare, we define first a function that returns for any shape k a list containing any cell c such that the top left cell of shape k could be placed on c while permitting the entire shape to be contained in the grid.
def domain_y(k):
    shape, height, width = shapes[k], len(shapes[k]), len(shapes[k][0])
    return [i * m + j for i in range(n - height + 1) for j in range(m - width + 1)
            if all(grid[i + gi][j + gj] == 1 or shape[gi][gj] == 0
              for gi in range(height) for gj in range(width))]
For example, when we execute:
print(domain_y(0))
[0, 4, 8]
we obtain a list with the indexes 0, 4 and 8, which correspond to the three highest cells of the first column of the grid.
The second array $y$ of variables is:
# y[k] is the base cell index in the grid where we start putting the kth shape
y = VarArray(size=nShapes, dom=domain_y)
We can display the structure of the array $y$, as well as the domains of the variables of $y$.
print("Array y: ", y)
print("Domains of variables of y: ", [y[k].dom for k in range(nShapes)])
Array y:  [y[0], y[1], y[2]]
Domains of variables of y:  [0 4 8, 0 1 2 4, 0 1 2 4]
For linking variables of $x$ and $y$, we use the tables defined by the following function:
def table(k):
    shape, height, width = shapes[k], len(shapes[k]), len(shapes[k][0])
    tbl = []
    for v in domain_y(k):
        i, j = v // m, v % m
        t = [(i + gi) * m + (j + gj) for gi in range(height) for gj in range(width)
             if shape[gi][gj] == 1]
        tbl.append((v,) + tuple(k if w in t else ANY for w in range(n * m)))
    return tbl
For example, when we execute:
print(*table(1), sep="\n")
(0, 1, 1, *, *, 1, 1, *, *, *, *, *, *, *, *, *, *, *, *, *, *, *, *, *, *, *, *, *, *)
(1, *, 1, 1, *, *, 1, 1, *, *, *, *, *, *, *, *, *, *, *, *, *, *, *, *, *, *, *, *, *)
(2, *, *, 1, 1, *, *, 1, 1, *, *, *, *, *, *, *, *, *, *, *, *, *, *, *, *, *, *, *, *)
(4, *, *, *, *, 1, 1, *, *, 1, 1, *, *, *, *, *, *, *, *, *, *, *, *, *, *, *, *, *, *)
we obtain four tuples. The first value of each tuple is the base cell where can be put the shape 1, and the other values indicate where the value 1 is consequently required in the grid.
Concerning the constraints, we just need to post four constraints Extension. Technically, note that (y[k], x) is a shortcut for (y[k], *flatten(x)).
satisfy(
    # putting shapes in the grid
    (y[k], x) in table(k) for k in range(nShapes)
);
We can display the internal representation of the posted constraints; this way, although a little bit technical, we can observe how these table constraints are formed.
print(posted())
extension(list:[y[0], x[0][0], x[0][1], x[0][2], x[0][3], x[1][0], x[1][1], x[1][2], x[1][3], x[2][0], x[2][1], x[2][2], x[2][3], x[3][0], x[3][1], x[3][2], x[3][3], x[4][0], x[4][1], x[4][2], x[4][3], x[5][0], x[5][1], x[5][2], x[5][3], x[6][0], x[6][1], x[6][2], x[6][3]], supports:(0,0,0,*,*,0,*,*,*,0,*,*,*,0,*,*,*,0,*,*,*,*,*,*,*,*,*,*,*)(4,*,*,*,*,0,0,*,*,0,*,*,*,0,*,*,*,0,*,*,*,0,*,*,*,*,*,*,*)(8,*,*,*,*,*,*,*,*,0,0,*,*,0,*,*,*,0,*,*,*,0,*,*,*,0,*,*,*))
extension(list:[y[1], x[0][0], x[0][1], x[0][2], x[0][3], x[1][0], x[1][1], x[1][2], x[1][3], x[2][0], x[2][1], x[2][2], x[2][3], x[3][0], x[3][1], x[3][2], x[3][3], x[4][0], x[4][1], x[4][2], x[4][3], x[5][0], x[5][1], x[5][2], x[5][3], x[6][0], x[6][1], x[6][2], x[6][3]], supports:(0,1,1,*,*,1,1,*,*,*,*,*,*,*,*,*,*,*,*,*,*,*,*,*,*,*,*,*,*)(1,*,1,1,*,*,1,1,*,*,*,*,*,*,*,*,*,*,*,*,*,*,*,*,*,*,*,*,*)(2,*,*,1,1,*,*,1,1,*,*,*,*,*,*,*,*,*,*,*,*,*,*,*,*,*,*,*,*)(4,*,*,*,*,1,1,*,*,1,1,*,*,*,*,*,*,*,*,*,*,*,*,*,*,*,*,*,*))
extension(list:[y[2], x[0][0], x[0][1], x[0][2], x[0][3], x[1][0], x[1][1], x[1][2], x[1][3], x[2][0], x[2][1], x[2][2], x[2][3], x[3][0], x[3][1], x[3][2], x[3][3], x[4][0], x[4][1], x[4][2], x[4][3], x[5][0], x[5][1], x[5][2], x[5][3], x[6][0], x[6][1], x[6][2], x[6][3]], supports:(0,2,2,*,*,2,2,*,*,*,*,*,*,*,*,*,*,*,*,*,*,*,*,*,*,*,*,*,*)(1,*,2,2,*,*,2,2,*,*,*,*,*,*,*,*,*,*,*,*,*,*,*,*,*,*,*,*,*)(2,*,*,2,2,*,*,2,2,*,*,*,*,*,*,*,*,*,*,*,*,*,*,*,*,*,*,*,*)(4,*,*,*,*,2,2,*,*,2,2,*,*,*,*,*,*,*,*,*,*,*,*,*,*,*,*,*,*))
Interestingly, by calling the function solve(), we can check that the problem is satisfiable (SAT). We can also display the found solution. Here, we call the function values() that collects the values assigned to a specified list of variables.
if solve() is SAT:
    print(values(x))
[
  [1, 1, 2, 2]
  [1, 1, 2, 2]
  [0, 0, -1, -1]
  [0, -1, -1, -1]
  [0, -1, -1, -1]
  [0, -1, -1, -1]
  [0, -1, -1, -1]
]
We can display the two possible solutions.
if solve(sols=ALL) is SAT:
    for i in range(n_solutions()):
        print(f"Solution {i}: {values(x, sol=i)}")
Solution 0: [
  [1, 1, 2, 2]
  [1, 1, 2, 2]
  [0, 0, -1, -1]
  [0, -1, -1, -1]
  [0, -1, -1, -1]
  [0, -1, -1, -1]
  [0, -1, -1, -1]
]
Solution 1: [
  [2, 2, 1, 1]
  [2, 2, 1, 1]
  [0, 0, -1, -1]
  [0, -1, -1, -1]
  [0, -1, -1, -1]
  [0, -1, -1, -1]
  [0, -1, -1, -1]
]
Finally, we give below the model in one piece. Here the data is expected to be given by the user (in a command line).
from pycsp3 import *

grid, shapes = data
n, m, nShapes = len(grid), len(grid[0]), len(shapes)


def domain_y(k):
    shape, height, width = shapes[k], len(shapes[k]), len(shapes[k][0])
    return [i * m + j for i in range(n - height + 1) for j in range(m - width + 1) if
            all(grid[i + gi][j + gj] == 1 or shape[gi][gj] == 0 for gi in range(height) for gj in range(width))]


def table(k):
    shape, height, width = shapes[k], len(shapes[k]), len(shapes[k][0])
    tbl = []
    for v in domain_y(k):
        i, j = v // m, v % m
        t = [(i + gi) * m + (j + gj) for gi in range(height) for gj in range(width) if shape[gi][gj] == 1]
        tbl.append((v,) + tuple(k if w in t else ANY for w in range(n * m)))
    return tbl


# x[i][j] is the index of the shape occupying the cell at row i and column j (or -1 if the cell is free)
x = VarArray(size=[n, m], dom=lambda i, j: {-1} if grid[i][j] == 0 else range(nShapes))

# y[k] is the (index of the) base cell in the grid where we start putting the kth shape
y = VarArray(size=nShapes, dom=domain_y)

satisfy(
    # putting shapes in the grid
    (y[k], x) in table(k) for k in range(nShapes)
)